Sometimes it is helpful to trace Data Guard background services so we can look at matching NSSn and RFS traces. For deep dives we also want to run TCP captures on both ends of a Data Guard configuration, and possibly on network components in the middle.
To minimize processing overhead on devices and noise in the capture files we want the packet filter to be as specific as possible. Just the source and target IP is not good enough, we also need a port number. Ideally, we apply the following filters to “tcpdump” in order to caputre the entire NSS <-> RFS traffic (but nothing more):
tcpdump 'host <primary IP> and port <NSSn port>'
NSSn is the process shipping the redo data from primary to standby. n is the number matching the LOG_ARCHIVE_DEST_n parameter for your redo transport configuration
Getting the IP of the primary host is easy, even if there is a separate network for Data Guard.
But how do we get the PORT of the NSSn process?
Method A
Identify the NSSn process on the primary:
select ses.sid, ses.serial#, ses.machine, ses.port, prc.pname, prc.spid, prc.stid, prc.tracefile
from gv$session ses
  join gv$process prc on (prc.inst_id = ses.inst_id and prc.addr = ses.paddr)
where prc.pname like 'NSS%'
;
![]()
The trick is to use the SPID as it is reflected in “v$session.process” on the standby database instance. In this case we query for process 4582 on the standby database:
select ses.sid, ses.serial#, ses.machine, ses.port, prc.pname, prc.spid, prc.stid, prc.tracefile
from gv$session ses
  join gv$process prc on (prc.inst_id = ses.inst_id and prc.addr = ses.paddr)
where ses.process = '4582'
;
![]()
In our example the port is 18274 resulting in this “tcpdump” command:
tcpdump 'host 192.168.55.71 and port 18274'
Method B
Use the same query to get the SPID of the NSSn process on the primary as in the first method.
With the SPID we can find the TCP connection details using the “ss” Linux utility:
ss -o -p -n -i | grep 4582
![]()
Voilà.
SQL trace
Obviously, with the respective SID/SERIAL# combinations you can enable the SQL trace on NSSn (primary) and RFS (standby):
Primary
exec dbms_monitor.session_trace_enable(session_id=> 83, serial_num => 57385, waits => true, binds => false)
Standby
exec dbms_monitor.session_trace_enable(session_id=> 191, serial_num => 37747, waits => true, binds => false)
Observation about the RFS process
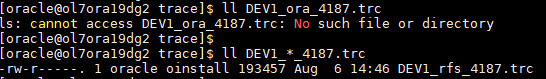
The RFS trace file name shows as “DEV1_ora_4187.trc” in “v$process”. In fact, RFS is not a background process (v$session.type = ‘USER’).
But here’s an oddity, when activating SQL trace on RFS the trace file does not materialize on the filesystem with that name. It actually materializes with “DEV1_rfs_4187.trc”.
RAC and Data Guard
In a MMA environment you’d probably want to capture traffic from all primary instances (on the host with the apply instance):
tcpdump '(host <primary IP A> and port <NSSn port A>) or (host <primary IP B> and port <NSSn port B>)'