Category Archives: Internals

Tracing Data Guard traffic

Sometimes it is helpful to trace Data Guard background services so we can look at matching NSSn and RFS traces. For deep dives we also want to run TCP captures on both ends of a Data Guard configuration, and possibly on network components in the middle.
To minimize processing overhead on devices and noise in the capture files we want the packet filter to be as specific as possible. Just the source and target IP is not good enough, we also need a port number. Ideally, we apply the following filters to “tcpdump” in order to caputre the entire NSS <-> RFS traffic (but nothing more):

tcpdump 'host <primary IP> and port <NSSn port>'

NSSn is the process shipping the redo data from primary to standby. n is the number matching the LOG_ARCHIVE_DEST_n parameter for your redo transport configuration

Getting the IP of the primary host is easy, even if there is a separate network for Data Guard.
But how do we get the PORT of the NSSn process?

Method A
Identify the NSSn process on the primary:

select ses.sid, ses.serial#, ses.machine, ses.port, prc.pname, prc.spid, prc.stid, prc.tracefile
from gv$session ses
  join gv$process prc on (prc.inst_id = ses.inst_id and prc.addr = ses.paddr)
where prc.pname like 'NSS%'
;


The trick is to use the SPID as it is reflected in “v$session.process” on the standby database instance. In this case we query for process 4582 on the standby database:

select ses.sid, ses.serial#, ses.machine, ses.port, prc.pname, prc.spid, prc.stid, prc.tracefile
from gv$session ses
  join gv$process prc on (prc.inst_id = ses.inst_id and prc.addr = ses.paddr)
where ses.process = '4582'
;

In our example the port is 18274 resulting in this “tcpdump” command:

tcpdump 'host 192.168.55.71 and port 18274'

Method B
Use the same query to get the SPID of the NSSn process on the primary as in the first method.
With the SPID we can find the TCP connection details using the “ss” Linux utility:

ss -o -p -n -i | grep 4582

VoilΓ .

SQL trace
Obviously, with the respective SID/SERIAL# combinations you can enable the SQL trace on NSSn (primary) and RFS (standby):

Primary

exec dbms_monitor.session_trace_enable(session_id=> 83, serial_num => 57385, waits => true, binds => false)

Standby

exec dbms_monitor.session_trace_enable(session_id=> 191, serial_num => 37747, waits => true, binds => false)

Observation about the RFS process
The RFS trace file name shows as “DEV1_ora_4187.trc” in “v$process”. In fact, RFS is not a background process (v$session.type = ‘USER’).
But here’s an oddity, when activating SQL trace on RFS the trace file does not materialize on the filesystem with that name. It actually materializes with “DEV1_rfs_4187.trc”.

RAC and Data Guard
In a MMA environment you’d probably want to capture traffic from all primary instances (on the host with the apply instance):

tcpdump '(host <primary IP A> and port <NSSn port A>) or (host <primary IP B> and port <NSSn port B>)'

Bugs are annoying – Kerberos ticket issue

Update 08-JUN-2018
This bug has been fixed with the Oracle 19.3 client release for Windows. Below workaround should not be necessary anymore.

One cool feature of using Kerberos authentication is that when you have a TGT (Ticket Granting Ticket) in the ticket cache the Oracle client software can use that to get a service ticket and log you into the database without further asking for any credentials (single sing-on).

Here’s what it looks like with a Kerberos authenticated SSH session on Linux:

As you can see from the screenshot the “orasrv” service ticket is flagged “forwardable” and the database login is successful (“-f” tells “oklist” to show the ticket flags).

On Windows on the other hand the same fails with “ORA-12638: Credential retrieval failed”:

If we change to “non-forwardable” service tickets it works on both, Linux and Windows:

How do you change to “non-forwardable” service tickets?
1) Use “okinit” to manually re-initialize your ticket cache. By default it will get “non-forwardable” tickets (or use “-F” to be explicit).

2) You can configure the service principal in Active Directory so only “non-forwadable” tickets will be issued (even when you use “okinit -f” to explicitly ask for “forwardable” tickets)

Both workarounds do the trick but I don’t like neither of them for their obvious drawbacks. After a few weeks trying to convince the Oracle Support Engineer of the issue bug 28734494 has been filed on Oct 8, 2018 with no notable progress to date πŸ™
Despite what the bug description says the issue is not MSLSA vs file ticket cache, it is the ticket flags that make or break.

Btw. I’ve tested client versions 12.2.0.1, 18.3, 18.5 and they all exhibit the same behaviour.

A story about Data Guard and network latency

Imagine you run a trading application that, every morning at market open, processes many thousands of orders from a queue using dozens of database connections. And as we all know, trade order processing is a time critical task.
The system is a two node RAC cluster that is backed by a Data Guard physical standby database with the exact same specifications and configuration. To give you an idea what is going on in the database during this peak order processing, here are a few AWR stats (this is from node 1, but node 2 very much looks the same):

									Per Second
DB Time(s):							23.7
DB CPU(s):							4.8
Background CPU(s):					0.6
Redo size (bytes):					2,569,543.4
Logical read (blocks):				692,837.9
Block changes:						11,668.0
Physical read (blocks):				463.7
Physical write (blocks):			219.8
Read IO requests:					416.8
Write IO requests:					99.6
Global Cache blocks received:		2,125.3
Global Cache blocks served:			2,368.7
User calls:							9,354.2
Parses (SQL):						6,208.7
Hard parses (SQL):					1.6	0.0
Executes (SQL):						14,642.5
Rollbacks:							6.9	0.0
Transactions:						518.9

This is a fairly busy system with 9000+ user calls and 500+ transactions per second. “DB CPU” is about 1/5 of “DB Time” and with 32 physical cores per node the system certainly is not CPU bound. Below stats are based on a 30 seconds snapshot interval (I know, it’s insanely short but we had our reasons πŸ™‚ ).

Event								Waits		Total Wait Time (sec)		Wait Avg(ms)	% DB time	Wait Class
log file sync						15,404		244.9						15.90			29.8		Commit
DB CPU							 				167.9	 									20.4	 
gc buffer busy release				2,601		101.1						38.87			12.3		Cluster
gc buffer busy acquire				7,240		81							11.19			9.8			Cluster
gc current block busy				4,662		78.8						16.91			9.6			Cluster
gc cr block busy					3,945		68.7						17.40			8.3			Cluster
cell single block physical read 	13,029		12.3						0.94			1.5			User I/O
enq: TX - index contention			653			7.3							11.21			.9			Concurrency
enq: TX - row lock contention		378			5.3							14.08			.6			Application
gc current block 2-way				24,480		4.4							0.18			.5			Cluster

The top 10 waits show that 30% of the time was spent on “log file sync” with almost 16ms average wait time. 16ms for commit latency seems high, let’s take a closer look in the wait event histogram:

Event			Waits 64ms to 2s		<32ms	<64ms	<1/8s	<1/4s	<1/2s	<1s		<2s		>=2s
log file sync	801						94.8	 .7		  .5	   3.7		.2		 .2

Most outliers (15404/100*3.7 = 570) are in the 128ms – 250ms bucket . “log file sync” is the wait from the foreground processes and in Oracle 12c the wait chain for Data Guard sync mode is as follows:

"log file sync" (foreground process)
	=> "SYNC Remote Write" (LGWR)
		=> "Redo Transport MISC" (NSSn)

So let’s see what we have in the wait stats for the background processes:

Event								Waits		%Time -outs		Total Wait Time (s)		Avg wait (ms)	Waits /txn		% bg time
gcs log flush sync					91,603		1				45						0.49			5.09			19.64
Redo Transport MISC					6,335		0				29						4.59			0.35			12.62
SYNC Remote Write					6,335		0				28						4.34			0.35			11.93
log file parallel write				6,297		0				3						0.54			0.35			1.49
gc current block busy				53			0				2						43.59			0.00			1.00
gc buffer busy release				18			0				1						72.30			0.00			0.56
...

While not great, the average for “Redo Transport MISC” is “only” 4.59ms as compared to the 16ms “log file sync”.
Background wait event histogram:

Event					Waits 64ms to 2s	<32ms	<64ms	<1/8s	<1/4s	<1/2s	<1s		<2s		>=2s
Redo Transport MISC		57					99.1	 .0		  .0	   .8		.0		 .0	 	 	 	 
SYNC Remote Write		57					99.1	 .0		  .0	   .8		.0		 .0	 	 

Same as for “log file sync” most of the outliers for the redo transmission wait events are in the 128ms – 250ms range.

It looks like the redo transmission from primary to standby is sometimes stalling LGWR and thus causing many foreground transactions to wait for LGWR (that’s why the average “log file sync” wait is so much higher).

SQL traces from NSS/RFS processes confirmed that there are around 80-120 outliers per minute. While the redo transmission is on TCP (or lower) the corresponding RFS process on the standby is waiting on “SQL*Net message from client” or “SQL*Net more data from client”.
NSS2 trace:

WAIT #0: nam='Redo Transport MISC' ela= 205429 p1=0 p2=0 p3=0 obj#=-1 tim=12736668661230

corresponding RFS trace:

WAIT #0: nam='SQL*Net message from client' ela= 207662 driver id=1413697536 #bytes=1 p3=0 obj#=-1 tim=18731316629403

This told us that both, the sender and the receiving process were waiting on the network stack and interestingly, in all instances the waits took a just a little over 200ms.

The next thing was running a TCP packet capture (tcpdump) on the primary & standby database servers to see what was going on on the network stack. This revealed that every time we saw a 200ms long “Redo Transport MISC” event in the NSS2 trace a TCP retransmission would occur, e.g.:

Why does it consistently take 200ms before the packet is retransmitted?
There is an exponential back-off algorithm in the Linux kernel for TCP retransmissions and it starts at 200ms in this environment:

$ grep '^CONFIG_HZ' /boot/config-$(uname -r)
CONFIG_HZ_1000=y
CONFIG_HZ=1000

$ grep '#define TCP_RTO_MIN' /usr/src/kernels/$(uname -r)/include/net/tcp.h
#define TCP_RTO_MIN	((unsigned)(HZ/5))

1000 HZ / 5 = 200ms(period). As in this case retransmissions only occur occasionally relative to the total packet volume the back-off algorithm never kicks in and the RTO stays at 200ms.

By the way, the retransmission timeout is calculated per port and the current value can be displayed using the “ss” command. For instance:

$ ss -o -p -n -i sport = :2483
Netid State      Recv-Q Send-Q                                                          Local Address:Port                                                                         Peer Address:Port              
tcp   ESTAB      0      0                                                        ::ffff:192.168.56.60:2483                                                                  ::ffff:192.168.56.1:46218               users:(("oracle_3485_dev",pid=3485,fd=16)) timer:(keepalive,9min52sec,0)
	 ts sack cubic wscale:7,7 rto:208 rtt:7.382/13.049 ato:40 mss:1448 rcvmss:1448 advmss:1448 cwnd:10 bytes_acked:5897 bytes_received:4860 send 15.7Mbps lastsnd:8237 lastrcv:8238 lastack:8237 pacing_rate 31.4Mbps rcv_rtt:60 rcv_space:28960
tcp   ESTAB      0      0                                                        ::ffff:192.168.56.60:2483                                                                  ::ffff:192.168.56.1:46086               users:(("oracle_2024_dev",pid=2024,fd=16)) timer:(keepalive,4min45sec,0)
	 ts sack cubic wscale:7,7 rto:212 rtt:11.107/15.77 ato:40 mss:1448 rcvmss:1448 advmss:1448 cwnd:10 bytes_acked:7009 bytes_received:7710 send 10.4Mbps lastsnd:1515530 lastrcv:1515611 lastack:315015 pacing_rate 20.9Mbps rcv_rtt:54 rcv_space:28960

You can see one port has RTO=208 and the other is RTO=212 but they are all close to 200ms.

What can we do about it?
Well, ideally you want no TCP retransmissions to occur in your network but that’s just not going to happen, after all TCP was designed to deal with lossy networks. In this system the retransmissions make less than 0.1% of all the Data Guard traffic, nevertheless the impact on the trading application is real. Since TCP_RTO_MIN and the back-off algorithm are hard-wired into the Linux kernel I only know of one way to change the minimum RTO:
Setup a separate network route for the Data Guard traffic (if you haven’t already for other reasons) and set the RTO on the IP route level:

ip route change <dest> dev <device> proto kernel scope link src <IP> \
  rto_min 10ms

With that retransmissions happen after 10ms instead of 200ms which mitigates the impact on LGWR and the foreground processes waiting for the redo data to be shipped. How low you can set the RTO depends on your network characteristics and you may need to dial in the value not to cause extra retransmissions.

ss -o -p -n -i sport = :2483
Netid State      Recv-Q Send-Q                                                          Local Address:Port                                                                         Peer Address:Port              
tcp   ESTAB      0      0                                                        ::ffff:192.168.56.60:2483                                                                  ::ffff:192.168.56.1:45430               users:(("oracle_1651_dev",pid=1651,fd=16)) timer:(keepalive,9min52sec,0)
	 ts sack cubic wscale:7,7 rto:11 rtt:0.303/0.43 ato:40 mss:1448 rcvmss:1448 advmss:1448 cwnd:10 bytes_acked:5897 bytes_received:4860 send 382.3Mbps lastsnd:5082 lastrcv:5421 lastack:5082 pacing_rate 764.3Mbps retrans:0/2 rcv_rtt:31 rcv_space:28960
tcp   ESTAB      0      0                                                        ::ffff:192.168.56.60:2483                                                                  ::ffff:192.168.56.1:45438               users:(("oracle_1655_dev",pid=1655,fd=16)) timer:(keepalive,9min54sec,0)
	 ts sack cubic wscale:7,7 rto:11 rtt:0.291/0.334 ato:40 mss:1448 rcvmss:1448 advmss:1448 cwnd:10 bytes_acked:5896 bytes_received:4860 send 398.1Mbps lastsnd:5082 lastrcv:5556 lastack:5082 pacing_rate 794.1Mbps retrans:0/2 rcv_rtt:69 rcv_space:28960

Thanks to the IP route configuration the socket level RTO now starts at 10ms (actually at 11ms in above example).

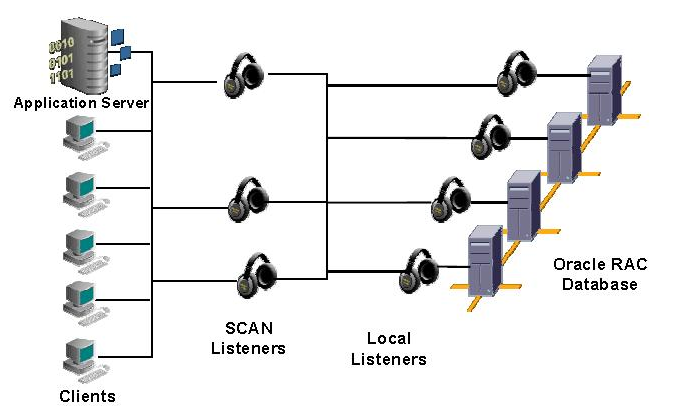
For single instance the setup is fairly simple, for RAC you need to provision an additional set of SCAN listeners.

To make the route change persistent across OS reboot I use a oneshot systemd unit.

Does the listener cache TLS certificates?

A while ago a fellow DBA asked me if the listener cached TLS certificates. My immediate answer was “Sure, not caching would hurt performance severely.”
But, I couldn’t be certain so I ran a trace on it.

As the listener.log shows I did connect three times using TLS enabled endpoint:

...
07-SEP-2018 11:05:30 * (CONNECT_DATA=(SERVICE_NAME=DEV1.localdomain)(CID=(PROGRAM=C:\app\oracle\product\client1830\bin\sqlplus.exe)(HOST=WIN2012CLI1)(USER=user1))) * (ADDRESS=(PROTOCOL=tcps)(HOST=192.168.56.29)(PORT=49211)) * establish * DEV1.localdomain * 0
07-SEP-2018 11:05:46 * (CONNECT_DATA=(SERVICE_NAME=DEV1.localdomain)(CID=(PROGRAM=C:\app\oracle\product\client1830\bin\sqlplus.exe)(HOST=WIN2012CLI1)(USER=user1))) * (ADDRESS=(PROTOCOL=tcps)(HOST=192.168.56.29)(PORT=49212)) * establish * DEV1.localdomain * 0
07-SEP-2018 11:05:48 * (CONNECT_DATA=(SERVICE_NAME=DEV1.localdomain)(CID=(PROGRAM=C:\app\oracle\product\client1830\bin\sqlplus.exe)(HOST=WIN2012CLI1)(USER=user1))) * (ADDRESS=(PROTOCOL=tcps)(HOST=192.168.56.29)(PORT=49213)) * establish * DEV1.localdomain * 0
...

During the entire time I had a listener trace and a β€œstrace” on the “tnslsnr” process.
Going through the strace output I found the open calls for both wallet files (ewallet.p12 and cwallet.sso).

Line 419: open("/u01/app/oracle/etc/wallet/auth/ewallet.p12", O_RDONLY) = 19
Line 506: open("/u01/app/oracle/etc/wallet/auth/cwallet.sso", O_RDONLY) = 20

Then the listener maps anonymous memory and reads data from cwallet.sso (file descriptor 20).

Line 514: mmap(NULL, 4096, PROT_READ|PROT_WRITE, MAP_PRIVATE|MAP_ANONYMOUS, -1, 0) = 0x7f0520168000
Line 517: read(20, "\272\333\241\211\10\to\264\306\247/w\217#\0n+[\t\371\v\266\244\230d\214e3\246ZV\22"..., 1149) = 1149
...
Line 531: read(20, "\241\370N8\0\0\0\6\0\0\0!\6\303\20]{\207\16_\246\247\3579'\234h\35I\301m="..., 4096) = 4096
...
Line 542: read(20, "\272\333\241\211\10\to\264\306\247/w\217#\0n+[\t\371\v\266\244\230d\214e3\246ZV\22"..., 4096) = 1149

Shortly thereafter, the listener closes the file handles and unmaps the anonymous memory.

Line 551: close(19)
Line 561: close(20)
Line 562: munmap(0x7f0520168000, 4096)            = 0

All this happens on the first incoming TLS connection request. After that it never touches any of the wallet files again.

The same can be observed in the listener.og: it opens/reads/closes the wallet file on the first incoming TLS connection request only.

Line 4473: CONNECTION REQUEST
Line 4627: snzdfo_open_file:Opening file /u01/app/oracle/etc/wallet/auth/ewallet.p12 with READ ONLY permissions
Line 4631: snzdfo_open_file:Opening file /u01/app/oracle/etc/wallet/auth/cwallet.sso with READ ONLY permissions
Line 4667: nztwOpenWallet:exit

I didn’t do any long running tests but I this proves that the listener does cache the certificate from the wallet (at least temporarily).

SCAN listener client connections

I can see how this depiction of client connections through SCAN listeners can be confusing. You might think that SCAN listeners connect to local listeners and pass through the connection from the client to the local listeners (like a proxy).

Source: support.oracle.com (MOS Doc ID 887522.1)

This would be a bad idea as all database traffic would now flow through the SCAN listeners. Instead, what actually happens is this: the SCAN listener sends a “redirect” message to the client and the client then establishes a new connection to the local listener given in the message.

I’m using a fail-over connect string to illustrate what happens if the primary database is on “ora122racB” cluster. This means the client will first go through all SCAN listeners on “ora122racA” cluster and then fail-over to the next address.

(DESCRIPTION=
  (ADDRESS_LIST=
    (ADDRESS=
      (PROTOCOL=TCP)(HOST=ora122racA-scan.localdomain)(PORT=1521)
    )
    (ADDRESS=
      (PROTOCOL=TCP)(HOST=ora122racB-scan.localdomain)(PORT=1521)
    )
  )
  (CONNECT_DATA=(SERVICE_NAME=racpdb1.localdomain))
)

Running a SQL*Net trace reveals the following sequence.
First, it expands the SCAN IPs:

nlad_expand_hst: Result: (DESCRIPTION=(ADDRESS_LIST=(ADDRESS=(PROTOCOL=TCP)(HOST=192.168.56.25)(PORT=1521))(ADDRESS=(PROTOCOL=TCP)(HOST=192.168.56.27)(PORT=1521))(ADDRESS=(PROTOCOL=TCP)(HOST=192.168.56.26)(PORT=1521))(ADDRESS=(PROTOCOL=TCP)(HOST=192.168.56.35)(PORT=1521))(ADDRESS=(PROTOCOL=TCP)(HOST=192.168.56.36)(PORT=1521))(ADDRESS=(PROTOCOL=TCP)(HOST=192.168.56.37)(PORT=1521)))(CONNECT_DATA=(SERVICE_NAME=racpdb1.localdomain)(CID=(PROGRAM=C:\app\oracle\product\ora12201\bin\sqlplus.exe)(HOST=T11967)(USER=spotonoracle))))
nlad_pr: entry
nlad_pr: description processing
nlad_pr: entry
snlinGetAddrInfo: entry
snlinGetAddrInfo: exit
nlad_pr: hostname 192.168.56.25
snlinFreeAddrInfo: entry
snlinFreeAddrInfo: exit
snlinGetAddrInfo: entry
snlinGetAddrInfo: exit
nlad_pr: hostname 192.168.56.27
snlinFreeAddrInfo: entry
snlinFreeAddrInfo: exit
snlinGetAddrInfo: entry
snlinGetAddrInfo: exit
nlad_pr: hostname 192.168.56.26
snlinFreeAddrInfo: entry
snlinFreeAddrInfo: exit
snlinGetAddrInfo: entry
snlinGetAddrInfo: exit
nlad_pr: hostname 192.168.56.35
snlinFreeAddrInfo: entry
snlinFreeAddrInfo: exit
snlinGetAddrInfo: entry
snlinGetAddrInfo: exit
nlad_pr: hostname 192.168.56.36
snlinFreeAddrInfo: entry
snlinFreeAddrInfo: exit
snlinGetAddrInfo: entry
snlinGetAddrInfo: exit
nlad_pr: hostname 192.168.56.37
snlinFreeAddrInfo: entry
snlinFreeAddrInfo: exit

The first connection is established to the first SCAN IP in above list.

nsc2addr: (DESCRIPTION=(ADDRESS=(PROTOCOL=TCP)(HOST=192.168.56.25)(PORT=1521))(CONNECT_DATA=(SERVICE_NAME=racpdb1.localdomain)(CID=(PROGRAM=C:\app\oracle\product\ora12201\bin\sqlplus.exe)(HOST=WIN10VM01)(USER=spotonoracle))))
...
nsprecv: 00 67 01 00 04 00 02 00  |.g......|
nsprecv: 22 00 20 5B 28 44 15 52  |"..[(DES|
nsprecv: 53 52 49 50 74 49 4F 4E  |CRIPTION|
nsprecv: 1D 28 54 4E 50 3D 29 98  |=(TMP=)(|
nsprecv: 26 52 4E 4D 55 4D 3D 32  |VSNNUM=2|
nsprecv: 40 32 33 37 35 36 38 50  |02375680|
nsprecv: 39 18 45 52 52 3D 31 22  |)(ERR=12|
nsprecv: 25 31 34 26 38 55 52 62  |514)(ERR|
nsprecv: 4F 54 5E 53 54 21 43 4B  |OR_STACK|
nsprecv: 3D 28 25 52 52 4F 12 3D  |=(ERROR=|
nsprecv: 28 23 4F 44 45 3D 71 32  |(CODE=12|
nsprecv: 35 11 34 49 24 45 4E 46  |514)(EMF|
nsprecv: 49 3F 34 29 29 29 30     |I=4)))) |

Since the SCAN listener does not know the service “racpdb1.localdomain” it does return an error. Remember, the primary database is running on the other cluster.
Then it tries the second SCAN IP from the list.

nsc2addr: (DESCRIPTION=(ADDRESS=(PROTOCOL=TCP)(HOST=192.168.56.27)(PORT=1521))(CONNECT_DATA=(SERVICE_NAME=racpdb1.localdomain)(CID=(PROGRAM=C:\app\oracle\product\ora12201\bin\sqlplus.exe)(HOST=WIN10VM01)(USER=spotonoracle))))
...
nsprecv: 00 67 01 00 04 00 02 00  |.g......|
nsprecv: 22 00 20 5B 28 44 15 52  |"..[(DES|
nsprecv: 53 52 49 50 74 49 4F 4E  |CRIPTION|
nsprecv: 1D 28 54 4E 50 3D 29 98  |=(TMP=)(|
nsprecv: 26 52 4E 4D 55 4D 3D 32  |VSNNUM=2|
nsprecv: 40 32 33 37 35 36 38 50  |02375680|
nsprecv: 39 18 45 52 52 3D 31 22  |)(ERR=12|
nsprecv: 25 31 34 26 38 55 52 62  |514)(ERR|
nsprecv: 4F 54 5E 53 54 21 43 4B  |OR_STACK|
nsprecv: 3D 28 25 52 52 4F 12 3D  |=(ERROR=|
nsprecv: 28 23 4F 44 45 3D 71 32  |(CODE=12|
nsprecv: 35 11 34 49 24 45 4E 46  |514)(EMF|
nsprecv: 49 3F 34 29 29 29 30     |I=4)))) |

Same error return message from this SCAN listener.
And then the third SCAN IP.

nsc2addr: (DESCRIPTION=(ADDRESS=(PROTOCOL=TCP)(HOST=192.168.56.26)(PORT=1521))(CONNECT_DATA=(SERVICE_NAME=racpdb1.localdomain)(CID=(PROGRAM=C:\app\oracle\product\ora12201\bin\sqlplus.exe)(HOST=WIN10VM01)(USER=spotonoracle))))
...
nsprecv: 00 67 01 00 04 00 02 00  |.g......|
nsprecv: 22 00 20 5B 28 44 15 52  |"..[(DES|
nsprecv: 53 52 49 50 74 49 4F 4E  |CRIPTION|
nsprecv: 1D 28 54 4E 50 3D 29 98  |=(TMP=)(|
nsprecv: 26 52 4E 4D 55 4D 3D 32  |VSNNUM=2|
nsprecv: 40 32 33 37 35 36 38 50  |02375680|
nsprecv: 39 18 45 52 52 3D 31 22  |)(ERR=12|
nsprecv: 25 31 34 26 38 55 52 62  |514)(ERR|
nsprecv: 4F 54 5E 53 54 21 43 4B  |OR_STACK|
nsprecv: 3D 28 25 52 52 4F 12 3D  |=(ERROR=|
nsprecv: 28 23 4F 44 45 3D 71 32  |(CODE=12|
nsprecv: 35 11 34 49 24 45 4E 46  |514)(EMF|
nsprecv: 49 3F 34 29 29 29 30     |I=4)))) |

Again, obvously, we get the same return message.

Now, the client fails over to the second address in the connection descriptor. It connects to the first SCAN IP from the list for cluster “ora122racB”. This time we expect a positive response from the SCAN listener.

nsc2addr: (DESCRIPTION=(ADDRESS=(PROTOCOL=TCP)(HOST=192.168.56.35)(PORT=1521))(CONNECT_DATA=(SERVICE_NAME=racpdb1.localdomain)(CID=(PROGRAM=C:\app\oracle\product\ora12201\bin\sqlplus.exe)(HOST=WIN10VM01)(USER=spotonoracle))))
...
nsprecv: 02 32 00 11 06 00 00 00  |.2......|
nsprecv: 01 40 54 41 44 44 52 45  |.@(ADDRE|
nsprecv: 43 53 3D 98 50 52 4F 54  |SS=(PROT|
nsprecv: 45 43 4F 4C 3D 54 43 50  |OCOL=TCP|
nsprecv: 22 28 71 4F 53 54 3D 24  |)(HOST=1|
nsprecv: 33 2E 32 95 32 2E 47 24  |92.168.5|
nsprecv: 3F 1E 15 39 29 14 87 2F  |6.33)(PO|
nsprecv: 92 54 3D 58 35 32 12 30  |RT=1521)|
nsprecv: 39 00 28 37 45 53 43 52  |).(DESCR|
nsprecv: 44 50 94 49 4F 4E 3D 28  |IPTION=(|
nsprecv: 46 44 44 27 45 53 53 3D  |ADDRESS=|
nsprecv: 28 50 85 4F 54 4F 43 4F  |(PROTOCO|
nsprecv: 9C 3D 54 23 50 29 28 48  |L=TCP)(H|
nsprecv: 48 53 65 3D 51 33 2F 12  |OST=192.| 
nsprecv: 34 58 88 74 87 45 1F 21  |168.56.3|
nsprecv: 98 29 68 50 4F 52 54 3D  |5)(PORT=|
nsprecv: 51 35 32 58 35 32 12 30  |1521))(C|
nsprecv: 5F 4E 4E 87 43 54 5F 44  |ONNECT_D|
nsprecv: 51 54 45 3D 28 53 45 52  |ATA=(SER|
nsprecv: 26 49 43 36 5F 4E 41 4D  |VICE_NAM|
nsprecv: 35 3D 61 77 47 83 19 84  |E=racpdb|
nsprecv: 35 30 4D 34 7C 3E 4C 56  |1.locald|
nsprecv: 63 6E 67 36 61 72 64 2E  |omain)(C|
nsprecv: 62 6F 8E 29 28 43 49 44  |ID=(PROG|
nsprecv: 3E 28 50 17 4F 47 52 41  |RAM=C:\a|
nsprecv: 4C 3D 22 37 5C 3F 72 51  |pp\oracl|
nsprecv: 68 6E 52 31 38 6C 6E 52  |e\produc|
nsprecv: 62 31 41 33 5E 92 73 2E  |t\ora122|
nsprecv: 3C 73 71 3F 79 7C 78 23  |01\bin\s|
nsprecv: 1E 65 29 65 29 28 48 4F  |qlplus.e|
nsprecv: 91 54 41 2F 28 53 45 52  |xe)(HOST|
nsprecv: 51 84 3F 27 34 87 37 51  |=WIN10VM|
nsprecv: 38 29 95 55 53 45 52 3D  |01)(USER|
nsprecv: 73 72 63 35 29 29 28 53  |=spotono|
nsprecv: 2F 4E 4E 18 43 54 5F 44  |racle))(|
nsprecv: 35 52 97 45 52 3F 64 65  |SERVER=d|
nsprecv: 87 69 63 65 74 65 64 29  |edicated|
nsprecv: 29 49 6F 53 54 41 4E 43  |)(INSTAN|
nsprecv: 46 5F 4E 67 4D 45 3D 45  |CE_NAME=|
nsprecv: 61 44 19 7E 34 38 14 57  |raccdb11|
nsprecv: 39 36                    |)))     |

Indeed, the listener did respond with the following redirect address (VIP from local listener):

(ADDRESS=(PROTOCOL=TCP)(HOST=192.168.56.33)(PORT=1521))

Now, the client connects the local listener given in the redirect message.

nsc2addr: (ADDRESS=(PROTOCOL=TCP)(HOST=129.168.56.33)(PORT=1521))

From here on the connection protocol takes its regular turn (same with or without SCAN).

I hope this makes it a bit more clear how clients connection to databases using SCAN listeners.

Tracing LDAP from CMU to AD

I know, how many acronyms can you use in a title?

This is a quick note about another tracing facility within Oracle. If you’re using Centrally Manager Users with Active Directory you can enable a trace for the LDAP searches Oracle performs.

Enable tracing:

alter system set events='trace[gdsi] disk low';

Disable tracing:

alter system set events='trace[gdsi] off';

Here are a few examples.

Failed Kerberos authentication

kzlg found dn in wallet
kzlg found pwd in wallet
kzlg found usr in wallet
kzlg found domain SPOTONORACLE; dc=spotonoracle,dc=com; 1 dirsrv
kzlg ldap_open win2012dc1.spotonoracle.com:636
kzlg DB-LDAP init SSL succeeded.
kzlg bind success
kzlg AD user name: user1@SPOTONORACLE.COM
kzlg default naming ctx: dc=spotonoracle,dc=com
kzlg search -s base -b dc=spotonoracle,dc=com
kzlg search filter: objectclass=*
kzlg AD lockout_duration: 18000000000
kzlg AD max_pwd_age: 36288000000000
kzlg search_ext -s sub -b dc=spotonoracle,dc=com
kzlg search filter: (&(objectclass=user)(userPrincipalName=user1@SPOTONORACLE.COM))
KZLG_ERR: failed the search err=28304.
kzlg number of entries: 0
KZLG_ERR: LDAPERR=28304, OER=28304
KZLG_ERR: error=28304
kzlg doing LDAP unbind 

Successful Kerberos authentication

kzlg found dn in wallet
kzlg found pwd in wallet
kzlg found usr in wallet
kzlg found domain SPOTONORACLE; dc=spotonoracle,dc=com; 1 dirsrv
kzlg ldap_open win2012dc1.spotonoracle.com:636
kzlg DB-LDAP init SSL succeeded.
kzlg bind success
kzlg AD user name: user1@SPOTONORACLE.COM
kzlg default naming ctx: dc=spotonoracle,dc=com
kzlg search -s base -b dc=spotonoracle,dc=com
kzlg search filter: objectclass=*
kzlg AD lockout_duration: 18000000000
kzlg AD max_pwd_age: 36288000000000
kzlg search_ext -s sub -b dc=spotonoracle,dc=com
kzlg search filter: (&(objectclass=user)(userPrincipalName=user1@SPOTONORACLE.COM))
kzlg number of entries: 1
kzlg found user entry: CN=user1,OU=users,OU=oracle,DC=spotonoracle,DC=com
kzlg search -s base -b
kzlg search filter: objectclass=*
kzlg get AD current time: 20181019155231.0Z
kzlg found user entry normalized: cn=user1,ou=users,ou=oracle,dc=spotonoracle,dc=com
kzlg search_ext -s sub -b dc=spotonoracle,dc=com
kzlg search filter: (&(objectclass=group)(member:1.2.840.113556.1.4.1941:=cn=user1,ou=users,ou=oracle,dc=spotonoracle,dc=com))
kzlg number of entries: 1
kzlg search_ext -s sub -b dc=spotonoracle,dc=com
kzlg search filter: (&(objectclass=group)(objectSid=S-1-5-21-4282430696-1338935355-568305779-513))
kzlg number of entries: 1
kzlg doing LDAP unbind 	

Failed TLS authentication

kzlg found dn in wallet
kzlg found pwd in wallet
kzlg found usr in wallet
kzlg found domain SPOTONORACLE; dc=spotonoracle,dc=com; 1 dirsrv
kzlg ldap_open win2012dc1.spotonoracle.com:636
kzlg DB-LDAP init SSL succeeded.
kzlg bind success
kzlg AD user name: cn=user1,ou=users,ou=oracle,dc=spotonoracle,dc=com
kzlg default naming ctx: dc=spotonoracle,dc=com
kzlg search -s base -b dc=spotonoracle,dc=com
kzlg search filter: objectclass=*
kzlg AD lockout_duration: 18000000000
kzlg AD max_pwd_age: 36288000000000
kzlg search_ext -s sub -b dc=spotonoracle,dc=com
kzlg search filter: (&(objectclass=user)(distinguishedName=cn=user1,ou=users,ou=oracle,dc=spotonoracle,dc=com))
KZLG_ERR: failed the search err=28304.
kzlg number of entries: 0
KZLG_ERR: LDAPERR=28304, OER=28304
KZLG_ERR: error=28304
kzlg doing LDAP unbind
kzlg found dn in wallet
kzlg found pwd in wallet
kzlg found usr in wallet 

Successful TLS authentication

kzlg found dn in wallet
kzlg found pwd in wallet
kzlg found usr in wallet
kzlg found domain SPOTONORACLE; dc=spotonoracle,dc=com; 1 dirsrv
kzlg ldap_open win2012dc1.spotonoracle.com:636
kzlg DB-LDAP init SSL succeeded.
kzlg bind success
kzlg AD user name: cn=user1,ou=users,ou=oracle,dc=spotonoracle,dc=com
kzlg default naming ctx: dc=spotonoracle,dc=com
kzlg search -s base -b dc=spotonoracle,dc=com
kzlg search filter: objectclass=*
kzlg AD lockout_duration: 18000000000
kzlg AD max_pwd_age: 36288000000000
kzlg search_ext -s sub -b dc=spotonoracle,dc=com
kzlg search filter: (&(objectclass=user)(distinguishedName=cn=user1,ou=users,ou=oracle,dc=spotonoracle,dc=com))
kzlg number of entries: 1
kzlg found user entry: CN=user1,OU=users,OU=oracle,DC=spotonoracle,DC=com
kzlg search -s base -b
kzlg search filter: objectclass=*
kzlg get AD current time: 20181019155506.0Z
kzlg found user entry normalized: cn=user1,ou=users,ou=oracle,dc=spotonoracle,dc=com
kzlg search_ext -s sub -b dc=spotonoracle,dc=com
kzlg search filter: (&(objectclass=group)(member:1.2.840.113556.1.4.1941:=cn=user1,ou=users,ou=oracle,dc=spotonoracle,dc=com))
kzlg number of entries: 1
kzlg search_ext -s sub -b dc=spotonoracle,dc=com
kzlg search filter: (&(objectclass=group)(objectSid=S-1-5-21-4282430696-1338935355-568305779-513))
kzlg number of entries: 1
kzlg doing LDAP unbind 

Thanks to this I could resolve the last road block. CMU with TLS/Kerberos is fully functioning.

Home is where the ORACLE_HOME is

Here’s a little SQL that may be helpful in certain troubleshooting situations. It can answer questions like:

  • Which ORACLE_HOME is my database running from?
  • Which server-side sqlnet.ora is used by my connection (TNS_ADMIN)?

Or more generally speaking: what’s the value of a given environment variable for my session’s server process.

with
  function get_env(var in varchar2)
  return varchar2
  is
    val varchar2(32767);
  begin
    dbms_system.get_env(get_env.var, get_env.val);
    return get_env.val;
  end;
select get_env('&var_name.') env_val from dual
/

Examples:

SQL> r
Enter value for var_name: ORACLE_HOME

ENV_VAL                                                                                                                                                                                                            
--------------------------------
/u01/app/oracle/product/ora12201                      

SQL> r
Enter value for var_name: TNS_ADMIN

ENV_VAL                                                                                                                                                                                                            
--------------------------------
/u01/app/oracle/network/admin

SQL> r
Enter value for var_name: PATH

ENV_VAL                                                                                                                                                                                                            
--------------------------------
 

Note, Oracle apparently intentionally redacts the value for certain environment variables, e.g. PATH.
But for the use cases above I’ve found it extremely useful…

SQL Plan Baselines – the parallel trap

Today, the good news is that I have time to write this blog post. The less good news is that our basement got flooded and I have to stay home. The bad news is, my current client does not allow remote work πŸ™
So, blog post it is…

There are a number of reasons why a SQL Plan Baseline might not get used. Here’s one I was not fully aware of until recently (although it makes perfect sense when you think about it): ALTER SESSION FORCE PARALLEL QUERY [PARALLEL n].
In the simplest of cases the outcome whether a SQL Plan Baseline is used depends on the following:

  • PARALLEL_DEGREE_POLICY parameter
  • table decoration (DEGREE)
  • optimizer enviroment used to generate the plan baseline (ENABLE PARALLEL / FORCE PARALLEL / FORCE PARALLEL n)
  • optimizer environment of the session executing the query (ENABLE PARALLEL / FORCE PARALLEL / FORCE PARALLEL n)
  • plan in the baseline (serial or parallel plan?)

The base of the test case is a simple table that I’m going to select:

create table t1
as
select rownum id, 'ABC' text
from dual connect by level <= 100
;

For every combination of interest we run through the following procedure:
1) open and configure a new session for the parse environment on which the plan baseline is based
2) run this query “select * from t1”
3) create a fixed plan baseline for the generated plan
4) re-connect and configure the parse environment for the executing session
5) run query from step 2) and collect cursor information
do steps 4) and 5) for ENABLE PARALLEL, FORCE PARALLEL, and FORCE PARALLEL n

Test 1: object DEGREE 1, parallel_degree_policy = manual

parsing session (SPB)
/
executing session
enable (serial plan) force (parallel plan) force 4 (parallel plan)
enable (default) used not used (*3) not used (*3)
force not used (*1) used used
force 4 not used (*2) used used

*1) Degree of Parallelism is 8 because of table property
*2) Degree of Parallelism is 4 because of session
*3) No note in the plan about DOP or baseline
Summary for test 1:
If you have a serial plan in the baseline and use any force parallel on the session the plan baseline is not used and you get a parallel plan.
If you have a parallel plan in the baseline and run the query on a session with ENABLE PARALLEL QUERY (default settings) the plan baseline is not used and you get a serial plan.

Test 2: object DEGREE 1, parallel_degree_policy = limited

parsing session (SPB)
/
executing session
enable (serial plan) force (parallel plan) force 4 (parallel plan)
enable (default) used used used (*3)
force not used (*1) used used (*3)
force 4 not used (*2) used used

*1) automatic DOP: Computed Degree of Parallelism is 2
*2) Degree of Parallelism is 4 because of session
*3) Degree of Parallelism is 2 because of hint
Summary for test 2:
If you have a serial plan in the baseline and use any force parallel on the session the plan baseline is not used and you get a parallel plan.
Now that we allow for auto DOP the session with ENABLE PARALLEL QUERY can use parallel plans in plan baselines.

Test 3: object DEGREE DEFAULT, parallel_degree_policy = limited

parsing session (SPB)
/
executing session
enable (serial plan (*4)) force (parallel plan) force 4 (parallel plan)
enable (default) used used used (*3)
force not used (*1) used used (*3)
force 4 not used (*2) used used

*1) automatic DOP: Computed Degree of Parallelism is 2
*2) Degree of Parallelism is 4 because of session
*3) Interestingly, there is no note about DOP in the plan at all. But it uses the plan baseline.
*4) automatic DOP: Computed Degree of Parallelism is 1 because of parallel threshold
Summary for test 3:
If you have a serial plan in the baseline and use any force parallel on the session the plan baseline is not used and you get a parallel plan.
Again, as we allow for auto DOP the session with ENABLE PARALLEL QUERY can use parallel plans in plan baselines. The result is the same as Test 2 but some the notes in the plans differ.

Test 4: object DEGREE DEFAULT, parallel_degree_policy = limited, fake stats so DOP > 1 for all plan baselines

parsing session (SPB)
/
executing session
enable (parallel plan (*1)) force (parallel plan) force 4 (parallel plan)
enable (default) used used used
force used used used
force 4 used used used

*1) automatic DOP: Computed Degree of Parallelism is 2
Summary for test 4:
Naturally, now that we always have parallel plans in the plan baselines and the object statistics call for auto DOP > 1 the plan baselines get used in all cases.

Why did I do this? See, there’s this batch job with a SQL that has a SQL Plan Baseline on it (serial plan). Now, every once in a while the run-time of this batch job goes through the roof and every time this happens I see that the query does not use the baseline (v$sql.sql_plan_baseline is NULL). Also, next to different PLAN_HASH_VALUEs I noticed different OPTIMIZER_ENV_HASH_VALUEs. Checking the session settings V$SES_OPTIMIZER_ENV showed that “parallel_query_forced_dop” was set to “default”, which means “ALTER SESSION FORCE PARALLEL QUERY” was run previously on that session.
But why is it not deterministic? The tool that runs all the batch jobs uses a connection pool, some job steps force parallel and some don’t. We haven’t been able to technically confirm this but everything points towards that this session property is not cleared to default when a connection gets reused. So, sometimes this batch job just gets unlucky by the session it gets from the connection pool.
The solution: Adding second SQL Plan Baseline. This plan is a parallel plan with the same structure as the original serial plan. Now, either one of the plan baselines (serial or parallel plan) is being used depending on the session configuration.

Footnote:
When you use “FORCE PARALLEL QUERY” you might get a serial plan. You’ll see this in the plan notes: “automatic DOP: Computed Degree of Parallelism is 1”. Obviously, this would change some of above results.

View merging limitation on OUTER JOIN

This is a short note about a limitation in complex view merging for outer joins.

We start with two simple tables, t1 and t2. To show the effect we don’t even need to load any data.

create table t1 (
    id1 number not null
  , vc1 varchar2(200)
);

create table t2 (
    id1 number not null
  , id2 number not null
  , num1 number
);

I know, I said it’s about outer joins but let’s first check the execution plan for the INNER JOIN.

explain plan for
select *
from t1
  inner join (
    select /*+ merge */
        id2
      , 0 x
      , sum(num1) sum_num1
    from t2
    group by id2
  ) s1 on (s1.id2 = t1.id1)
;

select * from dbms_xplan.display();

----------------------------------------------------------------------------
| Id  | Operation           | Name | Rows  | Bytes | Cost (%CPU)| Time     |
----------------------------------------------------------------------------
|   0 | SELECT STATEMENT    |      |     1 |   153 |     5  (20)| 00:00:01 |
|   1 |  HASH GROUP BY      |      |     1 |   153 |     5  (20)| 00:00:01 |
|*  2 |   HASH JOIN         |      |     1 |   153 |     4   (0)| 00:00:01 |
|   3 |    TABLE ACCESS FULL| T1   |     1 |   127 |     2   (0)| 00:00:01 |
|   4 |    TABLE ACCESS FULL| T2   |     1 |    26 |     2   (0)| 00:00:01 |
----------------------------------------------------------------------------

Oracle merges the inline view as instructed by the MERGE hint. Btw., I’m only using the hint for demonstration purposes.

What happens if we change the join to a LEFT OUTER JOIN?

explain plan for
select *
from t1
  left outer join (
    select /*+ merge */
        id2
      , 0 x
      , sum(num1) sum_num1
    from t2
    group by id2
  ) s1 on (s1.id2 = t1.id1)
;
select * from dbms_xplan.display();

-----------------------------------------------------------------------------
| Id  | Operation            | Name | Rows  | Bytes | Cost (%CPU)| Time     |
-----------------------------------------------------------------------------
|   0 | SELECT STATEMENT     |      |     1 |   143 |     5  (20)| 00:00:01 |
|*  1 |  HASH JOIN OUTER     |      |     1 |   143 |     5  (20)| 00:00:01 |
|   2 |   TABLE ACCESS FULL  | T1   |     1 |   115 |     2   (0)| 00:00:01 |
|   3 |   VIEW               |      |     1 |    28 |     3  (34)| 00:00:01 |
|   4 |    HASH GROUP BY     |      |     1 |    26 |     3  (34)| 00:00:01 |
|   5 |     TABLE ACCESS FULL| T2   |     1 |    26 |     2   (0)| 00:00:01 |
-----------------------------------------------------------------------------

The inline view is not merged anymore. The optimizer trace reveals why it cannot merge the view anymore:

CVM:   Checking validity of merging in query block SEL$2 (#2)
CVM:     CVM bypassed: View on right side of outer join contains view with illegal column.
CVM:     CVM bypassed: Externally referenced expressions are not merge-safe.
CVM:     CVM bypassed: view on right side of Outer Join + MuLTiple TABle.

In case you haven’t noticed, there’s this little expression in the projection of the inner SELECT on line 7 (“0 x”). As soon as we remove it, the view will be merged by the optimizer also for LEFT OUTER JOIN.

explain plan for
select *
from t1
  left outer join (
    select /*+ merge */
        id2
--    , 0 x
      , sum(num1) sum_num1
    from t2
    group by id2
  ) s1 on (s1.id2 = t1.id1)
;
select * from dbms_xplan.display();

----------------------------------------------------------------------------
| Id  | Operation           | Name | Rows  | Bytes | Cost (%CPU)| Time     |
----------------------------------------------------------------------------
|   0 | SELECT STATEMENT    |      |     1 |   153 |     5  (20)| 00:00:01 |
|   1 |  HASH GROUP BY      |      |     1 |   153 |     5  (20)| 00:00:01 |
|*  2 |   HASH JOIN OUTER   |      |     1 |   153 |     4   (0)| 00:00:01 |
|   3 |    TABLE ACCESS FULL| T1   |     1 |   127 |     2   (0)| 00:00:01 |
|   4 |    TABLE ACCESS FULL| T2   |     1 |    26 |     2   (0)| 00:00:01 |
----------------------------------------------------------------------------

Thanks to point and click tools *cough* Cognos *cough* I’ve seen this a lot lately πŸ˜‰

Footnote: tests run on 12.2.0.1

Parse overhead: NOT NULL vs CHECK(xyz IS NOT NULL)

Jonathan Lewis’ update on his post “Constraints, Inserts and bind” prompted another thought: is there a difference between a check constraint (IS NOT NULL) and a NOT NULL column declaration with regards to recursive queries that are run during parsing?

Let’s start with “CHECK(xyz IS NOT NULL)” constraints:

create table t2 (
    n1 number       check(n1 is not null)
  , v1 varchar2(10) check(v1 is not null)
)
;

exec dbms_monitor.session_trace_enable(null, null, true, false)
begin
  for idx in 1..100 loop
    execute immediate 'insert into t2 values (' || idx || ', ''ABC'')';
  end loop;
end;
/
commit;
exec dbms_monitor.session_trace_disable(null, null)

Next, we replace the check constraints with “NOT NULL” declarations.

create table t1 (
    n1 number       not null
  , v1 varchar2(10) not null
)
;

exec dbms_monitor.session_trace_enable(null, null, true, false)
begin
  for idx in 1..100 loop
    execute immediate 'insert into t1 values (' || idx || ', ''ABC'')';
  end loop;
end;
/
commit;
exec dbms_monitor.session_trace_disable(null, null)

The SQL trace file from the check constraints shows 107 distinct SQLs. One of them being (as one would expect after reading Jonathan’s post):

select condition from cdef$ where rowid=:1

The trace file from the “NOT NULL” declarations shows 106 distinct SQLs. You know which one’s not in there, right? πŸ˜‰

When every LIO counts, use “NOT NULL” declarations over “CHECK (xzy IS NOT NULL)” constraints!